Convert

Convert, transform, or export Orange Textable tables
Signals
Inputs:
Textable TableTable in the internal format of Orange Textable.
Outputs:
Orange Table(default)Data in the standard Table format of Orange Canvas (possibly transformed).
Textable TableTable in the internal format of Orange Textable (possibly transformed).
SegmentationSegmentation containing the output table in tab-delimited format.
Description
Convert, inputs data in the internal format of Orange Textable and enables the user to modify them (sorting, normalization, etc.), to convert them to other formats, in particular the standard Table format of Orange Canvas (suitable for further processing within Orange Canvas), or to export them in tab-delimited text format (either to a file or to the clipboard).
Table formats
The table representation format of Orange Canvas (Table type) presents compatibility issues with Unicode encoded data. Since this encoding is emerging as the most widely used standard for languages of the world, Orange Textable provides its own Unicode-friendly table representation format.
Widgets Count, Length, Variety, Category, and Context) thus produce tables in Orange Textable format. In order to be manipulated by the numerous tabulated data processing widgets offered by Orange Canvas, these data must be converted to the standard Table format of Orange Canvas (and to an encoding supported by this latter format).
Note that the internal Orange Textable Table type subdivides in several subtypes. In particular, the contingency tables (see Count widget) belong to the Crosstab subtype which itself subdivides in PivotCrosstab, FlatCrosstab, and WeightedFlatCrosstab. These three subtypes are equivalent with regard to the information they allow the user to store, and the easiest way to understand what differentiates them is to see an example.
Consider the following contingency table, of IntPivotCrosstab [1] type (such as produced by the Count widget):
| __context__ | unit1 | unit2 |
|---|---|---|
| context1 | 1 | 3 |
| context2 | 2 | 1 |
Here is the same information converted in FlatCrosstab format:
| __id__ | __unit__ | __context__ |
|---|---|---|
| 1 | unit1 | context1 |
| 2 | unit2 | context1 |
| 3 | unit2 | context1 |
| 4 | unit2 | context1 |
| 5 | unit1 | context2 |
| 6 | unit1 | context2 |
| 7 | unit2 | context2 |
This representation contains three columns carrying the headers __id__, __unit__ and __context__, and a number of rows equal to the total count of the contingency table. It is the standard way of encoding a contingency table in Orange Canvas, and it is required by widgets such as Correspondence Analysis (after conversion to the Table type defined by Orange Canvas).
The WeightedFlatCrosstab format produces a more compact representation by keeping only one copy of each distinct unit–context pair and by adding a column __count__ to save information on the number of repetition of each pair:
| __id__ | __unit__ | __context__ | __weight__ |
|---|---|---|---|
| 1 | unit1 | context1 | 1 |
| 2 | unit2 | context1 | 3 |
| 3 | unit1 | context2 | 2 |
| 4 | unit2 | context2 | 1 |
This format is sometimes used to represent contingency tables in third-party data analysis software. It is often called “sparse” matrix format. format.
Output channels
Regardless of the selected output table format (or the transforms that have been applied to the data, see Advanced interface below), the Convert widget emits data on three distinct output channels:
- The default output channel (Orange Table) emits data converted to standard Table format of Orange Canvas; it will typically be used for passing them to built-in Orange Canvas table processing widgets.
- The Textable Table channel outputs a table in the internal format of Orange Textable (usually after applying some set of transforms); it can then be sent to another instance of Convert (in cases where it is useful to apply transforms in distinct steps) or to an instance of the built-in Python script widget of Orange Canvas, for accessing the content of the table in a programmatic fashion.
- The Segmentation channel emits a segmentation with a single segment enclosing a version of the (possibly transformed) table in tab-delimited text format (in utf-8 encoding), which is suitable for further textual processing using Orange Textable widgets such as Recode or Segment for instance.
Basic interface
The basic version of the widget (see figure 1 below) is essentially limited to the Encoding section, which allows the user to select an encoding for the output data. This can be done separately for the data emitted in Orange Canvas Table format on the default output channel (Orange table drop-down menu) and for the data possibly exported to a text file in tab-delimited format (Output File). If certain characters cannot be converted to the specified encoding (for example accentuated characters in the ASCII encoding), they are automatically replaced by corresponding HTML entities (for example é for é).
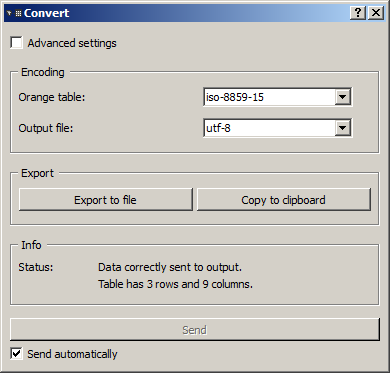
Figure 1: Convert widget (basic interface).
The Export section allows the user to export a version of the (possibly transformed) table in tab-delimited text format, either to a text file (Export to file) or to the clipboard (Copy to clipboard), in order to paste it to a spreadsheet opened in a third-party program for instance. In the former case, the Output file drop-down menu (section Encoding) is used to indicate which encoding the data should be converted to before being saved; typically, except for a limit imposed by the further processing planned for the saved data (for example by a specific data analysis program), we will seek to keep here the maximum amount of information by specifying either the original encoding of the data, or a more general encoding (a variant of Unicode for example). Note that when the data are copied to the clipboard, the utf-8 encoding is used by default (regardless of what has been selected in the Encoding section).
Advanced interface
The advanced version of the Convert widget (see figure 2 below) contains an additional section (Transform) allowing the user to apply a number of standard modifications to the incoming table. The different operations defined in this section are applied to input data in the order in which they appear in the interface, top to bottom. The modified data can then be emitted on output connections or exported (either to a file or to the clipboard).
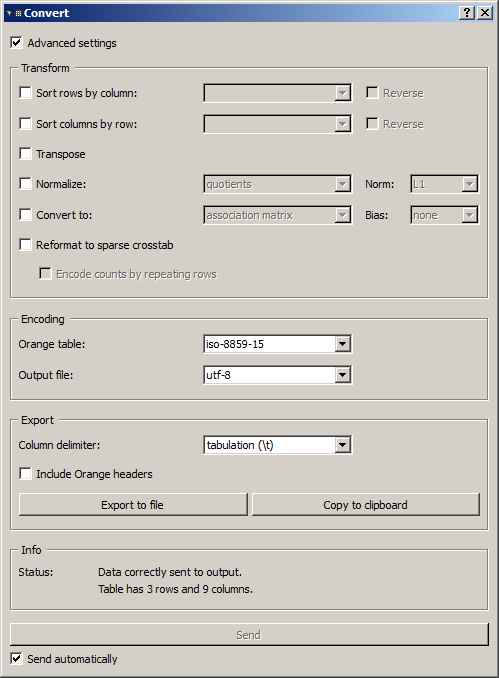
Figure 2: Convert widget (advanced interface).
The Sort rows by column checkbox triggers row sorting. If it is selected, the column headers of the table appear in the drop-down menu directly on the right and the user can thus select the column on the basis of which the rows will be sorted. If the Reverse box on the right of the drop-down menu is checked, rows will be sorted by decreasing value.
Sort columns by row controls in a similar way column sorting. It should be noted in this case that the first column (containing row headers) will always stay in the same position; the sorting only affects the following columns. To sort the columns based on the header row, you must select the first option in the Sort columns by row drop-down menu in the right. It will typically contain a name predefined by Orange Textable but which does not appear in the table (__unit__ if it is a contingency table of PivotCrosstab type such as produced by the Count widget, and the generic header __col__ in every other case).
The Transpose checkbox allows the user to transpose the table, which means invert its rows and columns. This option is only available for PivotCrosstab type contingency tables.
The Normalize checkbox triggers the normalization of the table (in a rather loose sense of the term); it is only applicable for PivotCrosstab type contingency tables. If it is selected, the user can choose in the drop-down menu directly on the right whether the normalization should be applied by rows (rows) or by columns (columns); the Norm drop-down menu allows the user to select the type of normalization, either L1 (division by the sum of the row/column) or L2 (division by the root of the sum of the squares of the row/column).
Three more operations (which are not usually classified as normalizations in the strict sense of the term) can be selected in the drop-down menu, each of which deactivates the Norm drop-down menu on the right:
- In quotients mode, the count stored in each cell of a contingency table (of PivotCrosstab type) is divided by the corresponding “theoretical” count under the hypothesis of independence between table rows and columns. This quotient is superior to 1 if the row and the column in question are in a mutual attraction relation, inferior to 1 in case of repulsion between the row and the column, finally equal to 1 if the row and column do not repulse nor attract each other particularly.
- In TF–IDF mode, the count stored in each cell of a contingency table (of PivotCrosstab type) is multiplied by the natural log of the ratio of the number of rows (i.e. contexts) having nonzero frequency for this column (i.e. unit) to the total number of rows.
- In presence/absence mode, counts greater than 1 are replaced by the value 1, so that the resulting table can contain only 0’s and 1’s.
The common property of all operations available in the Normalize drop-down menu is that they preserve the original dimensions of the input contingency table. On the contrary, the Convert to checkbox (only applicable for PivotCrosstab type tables) allows the user to trigger the application of transforms which actually modify the dimensionality of the table :
- In document frequency mode, a new contingency table is created, which giver, for each column (i.e. unit) the number of distinct rows (i.e. contexts) that have nonzero frequency (hence the resulting table contains a single row).
- In association matrix mode, a new symmetric table is constructed, where each cell gives a measure of the (Markov) associativity between a pair of columns (i.e. units) in the original contigency table: two columns are thus strongly associated if they have similar profiles of attraction/repulsion with rows (i.e. contexts). Selecting this mode activates the Bias drop-down menu on the right, which allows the user to select between three predefined ways of weighing the contributions of high versus low frequencies in this computation: frequent emphasizes strong associations between frequent units; none provides a balanced compromise between frequent and rare units; rare emphasizes strong associations between rare units (note that in this particular case, values greater than 1 express an attraction and values lesser than 1 a repulsion) [2].
It is worth mentioning that the Normalize and Convert to checkboxes are mutually exclusive and deactivate one another.
Finally, the Reformat to sparse crosstab checkbox allows the user to convert a contingency table from the PivotCrosstab format to the WeightedFlatCrosstab or from IntPivotCrosstab to IntWeightedFlatCrosstab (see the Table formats section above). In turn, data in IntWeightedFlatCrosstab format can be converted to FlatCrosstab by further selecting option Encode counts by repeating rows; the latter option is only available when dealing with tables containing integer values.
Compared to its basic version (see Basic interface above), the advanced version of the Export section offers two extra controls. The Column delimiter drop-down menu allows the user to select the column separator that will be inserted between cell values when exporting a table in text format; possible choices are tabulation (t), comma (,), and semi-colon (;). The Output Orange headers checkbox allows the user to indicate if the output should include every header line of the format .tab specific to Orange Canvas (Output Orange headers)–which is useful only for re-importing the exported table using the built-in File widget of Orange Canvas (and in fact often necessary in that case). Both parameters (Column delimiter and Output Orange headers also apply to the data sent on the Segmentation output channel)
The Info section indicates the number of lines and columns in the output table, or the reasons why no table is emitted (no input data).
The Send button triggers data emission to the output connection(s) (see Output channels above). When it is selected, the Send automatically checkbox disables the button and the widget attempts to automatically send data at every modification of its interface or when its input data are modified (by deletion or addition of a connection, or because modified data is received through an existing connection).
Messages
Information
- Data correctly sent to output: table has <n> and <m> columns.
- This confirms that the widget has operated properly.
- Settings were (or Input has) changed, please click ‘Send’ when ready.
- Settings and/or input have changed but the Send automatically checkbox has not been selected, so the user is prompted to click the Send button (or equivalently check the box) in order for computation and data emission to proceed.
- No data sent to output yet: no input table.
- The widget instance is not able to emit data to output because it receives none on its input channel(s).
See also
Footnotes
| [1] | IntPivotCrosstab is in turn a subtype of PivotCrosstab (and similarly IntWeightedFlatCrosstab is a subtype of WeightedFlatCrosstab), whose specificity is to be limited to integer values. |
| [2] | For more details on the calculation of Markov associativities, see Bavaud F. and Xanthos A. (2005). Markov associativities. Journal of Quantitative Linguistics, 12:123–137. Details on the effect of the bias parameter can be found in Deneulin, P., Gautier, L., Le Fur, Y., and Bavaud, F. (2014). Corrélats textuels autour du concept de minéralité dans les vins. In Actes des 12èmes Journées internationales d’analyse statistique des données textuelles (JADT 2014), pp. 209–223; the predefined values of this parameter (frequent, none, and rare) correspond respectively to values 1, 0.5 and 0 of parameter alpha in the above cited reference. |