Term frequency comparison in Melville’s Moby Dick
(This use case was designed with the help of Douglas Duhaime and the following text was slightly adapted from a description kindly contributed by him.)
This case study is adapted from Matthew Jocker’s excellent work Text Analysis with R for Students of Literature (46). The goal here is to visualize the frequency of the terms “Ahab” and “whale(s)” within Herman Melville’s masterpiece Moby Dick. The workflow reproduced on figure 1 below retrieves the text from Project Gutenberg, splits the work into its constitutive chapters, and measures the degree to which each of the target terms appears in each chapter. [1]
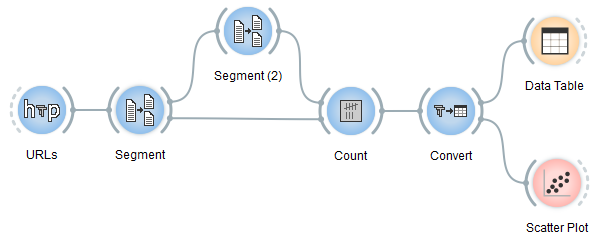
Figure 1: Orange Textable workflow for visualizing term frequency in Moby Dick.
Clicking on the Scatter Plot instance, one can easily see the relative frequency of the term whale(s) in each chapter of Melville’s novel (see figure 2 below). By toggling the Y-axis Attribute dropdown box, one can select Ahab and visualize the frequency of Ahab in the novel.
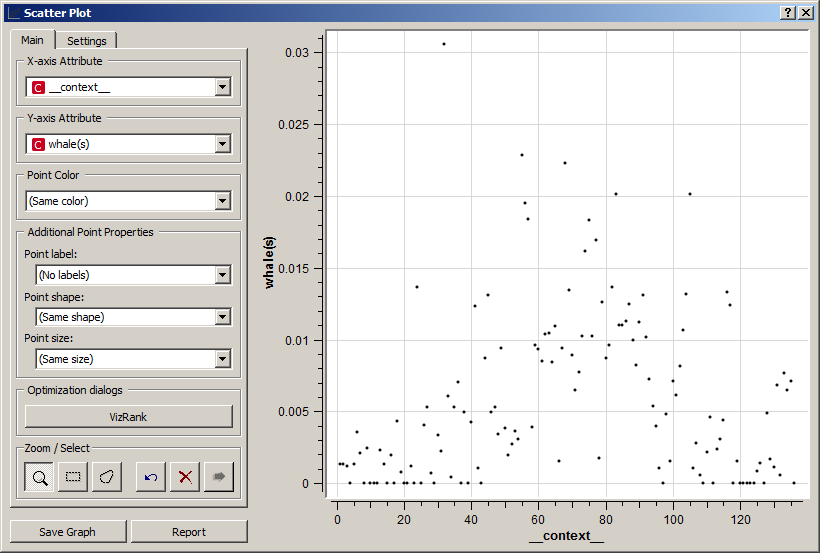
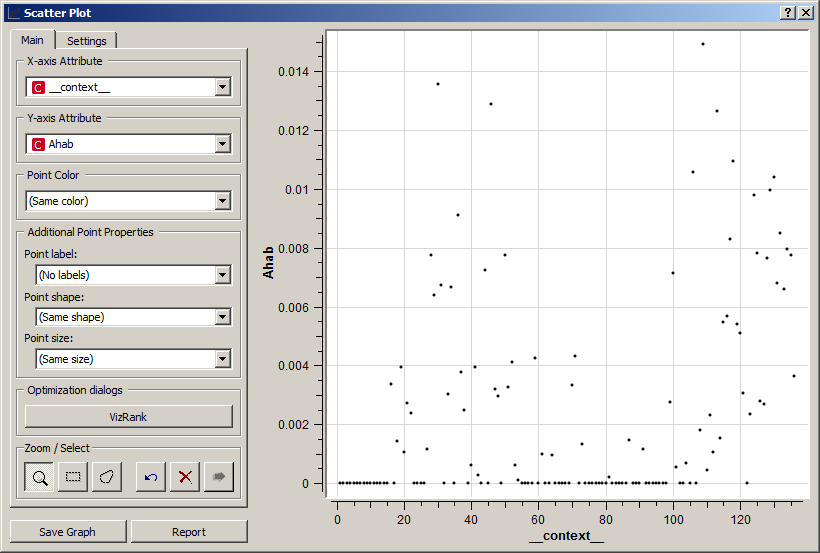
Figure 2: Negative correlation between the relative frequency of terms whale(s) (top) and Ahab (bottom) in Melville’s novel.
Although one might have supposed that the distribution of Captain Ahab would closely resemble that of whales within the novel, the plots above tell a different story. While Ahab is most present in early and then later chapters, whales are most present in the novel’s middle chapters, creating something of an inverse relationship between the two. For the literary critic, this relationship offers new evidence with which to evaluate the strategy and structure of Melville’s novel.
| [1] | The schema can be downloaded from here. |